One Source, Many Outputs

Ben Ballard

August 18, 2026

The reason to write analysis in Quarto rather than a notebook plus a separate deck is that the deck stops drifting from the analysis. This page and the PDF, reveal.js and PowerPoint versions linked beside the title all came from one index.qmd. Nothing was copied.

Getting that to work is mostly about three constraints, which are easier to accept up front than to retrofit.

Rule 1: Headings are slide boundaries

In the article formats a ## heading starts a section. In reveal.js and PowerPoint the same heading starts a slide, and its content has to fit on one.

That is a real writing constraint, not a formatting detail. It means a few tight paragraphs and one figure per heading. The upside is that prose written this way is better prose — if a section does not fit on a slide, it was probably doing two things at once.

Rule 2: Static figures only

An interactive Plotly chart is JavaScript. There is no sensible way to put it on a PDF page or a PowerPoint slide, so a multi-format document uses matplotlib.
import numpy as np
import matplotlib.pyplot as plt

years = np.arange(0, 31)
fig, ax = plt.subplots(figsize=(8, 4.2))

for rate, color in [(0.04, "#95a5a6"), (0.07, "#1f4e79"), (0.10, "#c0392b")]:
    ax.plot(years, 10_000 * (1 + rate) ** years,
            color=color, linewidth=2, label=f"{rate:.0%} annual return")

ax.set_xlabel("Years")
ax.set_ylabel("Value of $10,000")
ax.yaxis.set_major_formatter(lambda x, _: f"${x/1000:,.0f}k")
ax.legend(frameon=False, loc="upper left")
ax.spines[["top", "right"]].set_visible(False)
plt.show()

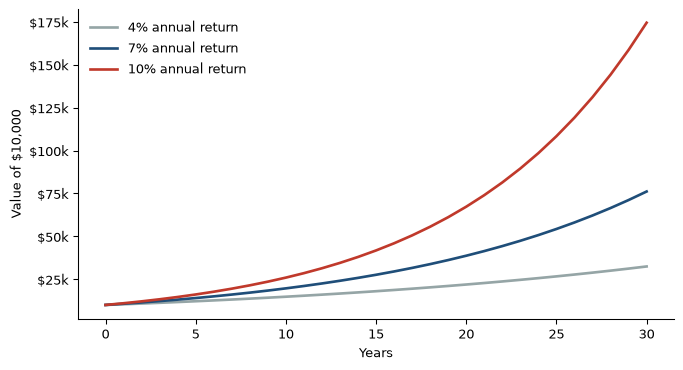
Figure 1: Compounding is the least intuitive arithmetic in finance.

Three percentage points of annual return is a factor of two and a half over thirty years, which is Figure 1’s entire point.

Rule 3: Content that only belongs in one place gets fenced

Some material is web-only — a long appendix, a data dictionary, an interactive widget. Some is slide-only, like a punchline with no supporting text. Quarto’s conditional divs handle both.

This paragraph appears only in the HTML version. It is the natural home for the caveats and the methodology notes that would ruin a slide.

The mechanism is ::: {.content-visible when-format="html"}. There is also content-hidden, and when-format accepts pdf, revealjs and pptx.

Slides get their own version

Short. Punchy. No caveats.

What the formats cost

Each extra format is a line of YAML and a slower render. The honest accounting:

Format Good for Watch out for
html The canonical post Nothing; this is the default
pdf Sending to someone, printing Needs LaTeX; wide tables overflow
revealjs Presenting from a browser Content must fit a slide
pptx Someone who needs to edit it No theme control worth relying on

I default to HTML only, and add formats to a specific post when there is an actual reason. format-links in the HTML sidebar generates the download links automatically, so readers get them for free whenever a post declares extra formats.

The takeaway

Write the analysis once, in the format that keeps the code next to the claim. Decide later who needs it as a document.