Reading a prediction market’s order book as a probability estimate, and the two ways it lies to you: a one-cent price floor on longshots, and a book that adds up to more than 100%.
Author
Ben Ballard
Published
August 20, 2026
Kalshi runs a market for who wins the 2026 season’s College Football Playoff National Championship: fifty separate contracts, one per team, each paying $1 if that team wins and $0 if it doesn’t. The price of a contract is denominated in cents, and if you squint, a cent is a percentage point — a contract trading at 9¢ is the market saying “9%.”
That’s the pitch for prediction markets: instead of asking an analyst for their gut feeling, you get a number people were willing to bet real money on. First question worth checking, before trusting that number for anything: does it actually behave like a probability?
Pulling the board
Code
import pandas as pdfrom sitelib.kalshi import KalshiClientclient = KalshiClient()markets = client.get_markets(series_ticker="KXNCAAF", status="open")df = pd.DataFrame( {"team": m["yes_sub_title"],"bid": float(m["yes_bid_dollars"]),"ask": float(m["yes_ask_dollars"]),"last": float(m["last_price_dollars"]),"volume": float(m["volume_fp"]),"open_interest": float(m["open_interest_fp"]), }for m in markets).sort_values("ask", ascending=False).reset_index(drop=True)print(f"{len(df)} teams still have a contract on the board")
50 teams still have a contract on the board
Each row is a bid and an ask, same as any order book: the ask is what it costs to bet yes on that team right now, the bid is what someone will pay you to bet yes right now. The gap between them is the cost of trading immediately rather than waiting for a better price — call it the market’s estimate, plus a small tax for wanting an answer this second.
The favorites
Code
import matplotlib.pyplot as plttop = df.head(10).iloc[::-1]fig, ax = plt.subplots(figsize=(8, 5))ax.barh(top["team"], top["ask"] *100, color="#1f4e79")ax.set_xlabel("Implied win probability (%)")ax.spines[["top", "right"]].set_visible(False)plt.show()
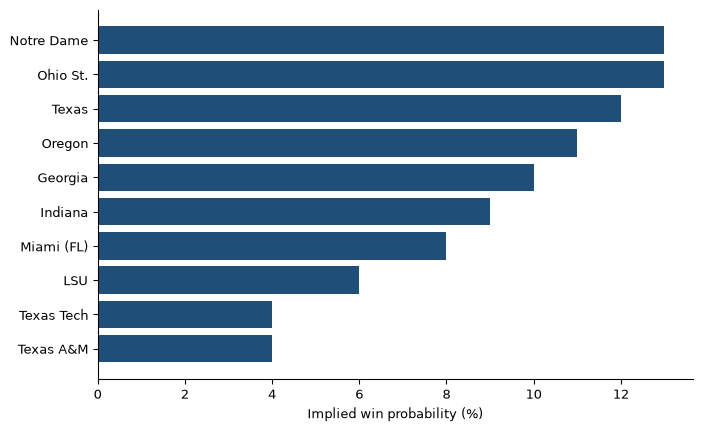
Figure 1: Implied win probability (ask price) for the ten shortest-odds teams in the CFP championship market.
Figure 1 is the market’s answer to “who’s going to win,” priced in real dollars rather than a preseason poll. It’ll be a different bar chart by January — that’s the point of pulling it from a live order book instead of writing down an opinion.
Where the probability story breaks down
Two things in this board don’t behave the way “price equals probability” would suggest.
The price floor. Kalshi won’t quote a contract below 1¢. Look at the bottom of the board:
Every team here is asking 1¢ with a 0¢ bid and little or no volume — not because the market has priced each of them at exactly a 1-in-100 shot, but because a cent is the smallest unit Kalshi trades in and nobody has bothered to trade these at all. A true probability estimate would let a hundred different longshots be a hundred different sizes of unlikely. This board can’t tell you if a team is a 1% shot or a 0.01% shot; both round to the same 1¢ floor.
The book doesn’t sum to 100%. Exactly one of these fifty teams will win, so a coherent set of probabilities should add up to 1.0.
Code
implied_total = df["ask"].sum()print(f"sum of ask-price implied probabilities: {implied_total:.2f}")
sum of ask-price implied probabilities: 1.43
It doesn’t — it adds up to noticeably more than one. That gap is the same thing as the vig on a sportsbook line: paying the ask on every team simultaneously would cost more than $1 total, guaranteeing a loss no matter who wins. The overround is spread unevenly, too — thin, 1¢-floored longshots contribute more excess probability per team than liquid favorites do, because the floor stops their price from ever reading as low as their real chances.
What I’d check next
Whether the favorites list actually tracks something real — lining this up against a win-total or power-rating source partway through the season, to see whether the market or the model moves first when a team starts losing. And whether the overround shrinks as the season progresses and the field of fifty collapses to a handful of live contenders with real volume behind them.
Source Code
---title: "What Kalshi Thinks Will Win the College Football Playoff"description: > Reading a prediction market's order book as a probability estimate, and the two ways it lies to you: a one-cent price floor on longshots, and a book that adds up to more than 100%.date: 2026-08-20categories: [kalshi, prediction-markets, college-football]---Kalshi runs a market for who wins the 2026 season's College FootballPlayoff National Championship: fifty separate contracts, one per team,each paying \$1 if that team wins and \$0 if it doesn't. The price of acontract is denominated in cents, and if you squint, a cent is apercentage point — a contract trading at 9¢ is the market saying "9%."That's the pitch for prediction markets: instead of asking an analystfor their gut feeling, you get a number people were willing to bet realmoney on. First question worth checking, before trusting that numberfor anything: does it actually behave like a probability?## Pulling the board```{python}import pandas as pdfrom sitelib.kalshi import KalshiClientclient = KalshiClient()markets = client.get_markets(series_ticker="KXNCAAF", status="open")df = pd.DataFrame( {"team": m["yes_sub_title"],"bid": float(m["yes_bid_dollars"]),"ask": float(m["yes_ask_dollars"]),"last": float(m["last_price_dollars"]),"volume": float(m["volume_fp"]),"open_interest": float(m["open_interest_fp"]), }for m in markets).sort_values("ask", ascending=False).reset_index(drop=True)print(f"{len(df)} teams still have a contract on the board")```Each row is a bid and an ask, same as any order book: the ask is what itcosts to bet *yes* on that team right now, the bid is what someone willpay you to bet *yes* right now. The gap between them is the cost oftrading immediately rather than waiting for a better price — call it themarket's estimate, plus a small tax for wanting an answer this second.## The favorites```{python}#| label: fig-favorites#| fig-cap: "Implied win probability (ask price) for the ten shortest-odds teams in the CFP championship market."import matplotlib.pyplot as plttop = df.head(10).iloc[::-1]fig, ax = plt.subplots(figsize=(8, 5))ax.barh(top["team"], top["ask"] *100, color="#1f4e79")ax.set_xlabel("Implied win probability (%)")ax.spines[["top", "right"]].set_visible(False)plt.show()```@fig-favorites is the market's answer to "who's going to win," priced inreal dollars rather than a preseason poll. It'll be a different bar chartby January — that's the point of pulling it from a live order bookinstead of writing down an opinion.## Where the probability story breaks downTwo things in this board don't behave the way "price equals probability"would suggest.**The price floor.** Kalshi won't quote a contract below 1¢. Look at thebottom of the board:```{python}bottom = df.tail(8)[["team", "bid", "ask", "volume"]]bottom```Every team here is asking 1¢ with a 0¢ bid and little or no volume —not because the market has priced each of them at exactly a 1-in-100shot, but because a cent is the smallest unit Kalshi trades in andnobody has bothered to trade these at all. A true probability estimatewould let a hundred different longshots be a hundred different sizes ofunlikely. This board can't tell you if a team is a 1% shot or a0.01% shot; both round to the same 1¢ floor.**The book doesn't sum to 100%.** Exactly one of these fifty teams willwin, so a coherent set of probabilities should add up to 1.0.```{python}implied_total = df["ask"].sum()print(f"sum of ask-price implied probabilities: {implied_total:.2f}")```It doesn't — it adds up to noticeably more than one. That gap is thesame thing as the vig on a sportsbook line: paying the *ask* on everyteam simultaneously would cost more than \$1 total, guaranteeing a lossno matter who wins. The overround is spread unevenly, too — thin,1¢-floored longshots contribute more excess probability per team thanliquid favorites do, because the floor stops their price from everreading as low as their real chances.## What I'd check nextWhether the favorites list actually tracks something real — lining thisup against a win-total or power-rating source partway through theseason, to see whether the market or the model moves first when a teamstarts losing. And whether the overround shrinks as the seasonprogresses and the field of fifty collapses to a handful of livecontenders with real volume behind them.